
Financial Results
We commit to be a responsible industry leader by leveraging on the strengths of our people, processes, and technologies to create value for our stakeholders.
Find financial news, results, and key performance ratios here, readily available at your fingertips.








Condensed Interim Financial Statements For the Second Half Year (“2H2026”) and Full Year (“FY2026”) Ended 30 June 2026
Profit or Loss
Balance Sheet
Review of Performance
Statement of Comprehensive Income
Revenue
Business Segments:
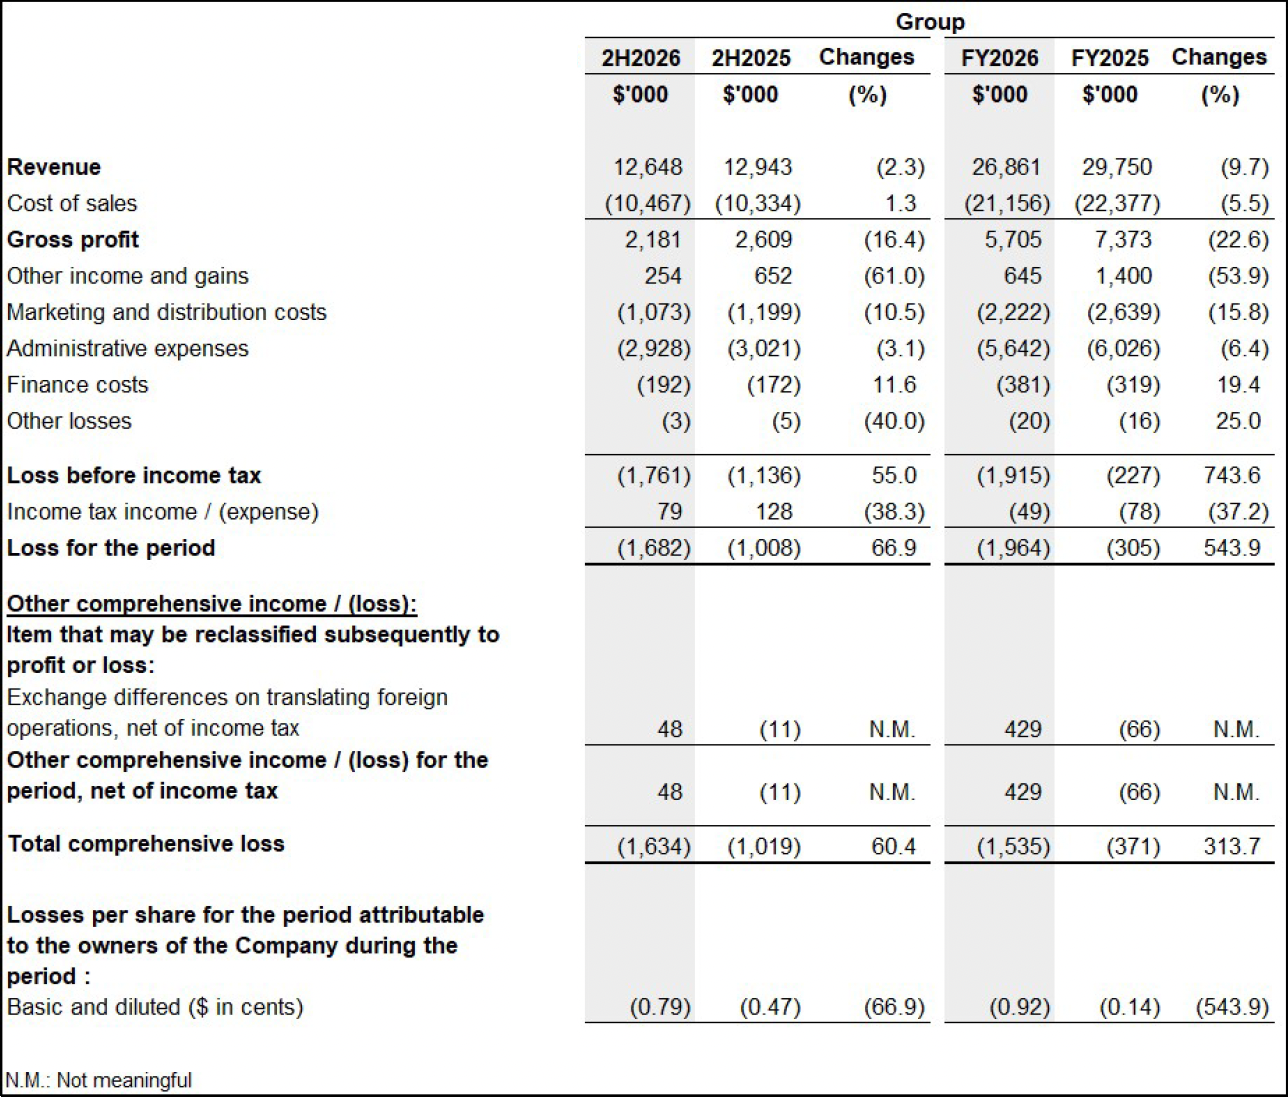
Revenue decreased by approximately $2.9 million, or 9.7%, from $29.8 million in FY2025 to $26.9 million in FY2026 mainly due to lower sales across all the segments, except for the General Trade segment.
- Modern Trade Segment: Revenue declined by approximately $0.4 million, or 5.7%, from $7.0 million in FY2025 to $6.6 million in FY2026, largely due to subdued consumer sentiment and intensified competition from house brands amid a wider variety of product offerings in the market.
- General Trade Segment: Revenue increased by approximately $0.1 million, or 1.0%, from $9.8 million in FY2025 to $9.9 million in FY2026, supported by higher demand from customers in Malaysia.
- Food Services Segment: Revenue decreased by approximately $0.2 million, or 2.6%, from $7.7 million in FY2025 to $7.5 million in FY2026, mainly due to weaker sales in the increasingly competitive Food and Beverage industry.
- Others Segment: Revenue decreased significantly by approximately $2.4 million, or 46.2%, from $5.2 million in FY2025 to $2.8 million in FY2026, primarily due to lower sales generated form the export segment.
Geographical Information:
- Singapore Market: Revenue decreased by approximately $1.7 million, or 7.8%, from $21.4 million in FY2025 to $19.7 million in FY2026, reflecting lower consumer demand across all segments.
- Malaysia Market: Revenue increased by approximately $1.2 million, or 28.6%, from $4.2 million in FY2025 to $5.4 million in FY2026, mainly attributable to higher demand from customers, particularly from General Trade and Food Service segments.
- Other Markets: Revenue decreased significantly by approximately $2.4 million, or 58.5%, from $4.1 million in FY2025 to $1.7 million in FY2026, due to lower export sales arising from evolving overseas dynamics and changes in customers order patterns.
Cost of Sales:
Cost of sales decreased by approximately $1.2 million, or 5.5%, from $22.4 million in FY2025 to $21.2 million in FY2026, in line with lower sales.
Gross Profit and Gross Profit Margin:
Gross profit decreased by approximately $1.7 million, or 22.6%, from $7.4 million in FY2025 to $5.7 million in FY2026. Gross profit margin declined from 24.8% in FY2025 to 21.2% in FY2026, mainly due to lower production efficiency arising from reduced production volume, which was attributable to lower sales and the Malaysia factory not yet operating at full capacity pending approval of the export permit from relevant authorities.
Other Income and Gains:
Other income and gains decreased by approximately $0.8 million, or 53.9%, from $1.4 million in FY2025 to $0.6 million in FY2026, mainly due to lower foreign exchange translation gains of approximately $0.3 million recognised in FY2026. The foreign exchange translation gains were mainly attributable to the appreciation of the Malaysian Ringgit against the Singapore Dollar (“SGD”) on SGD-denominated loans extended to the Group’s Malaysian subsidiary. The lower gains in FY2026 were due to the reduction in such loans following their conversion into equity. In addition, the decrease was due to the absence of a gain on disposal of investment in joint venture of approximately $0.5 million recorded in FY2025.
Expenses
- Marketing and Distribution Costs: Decreased by approximately $0.4 million, or 15.8%, from $2.6 million in FY2025 to $2.2 million in FY2026, mainly due to lower advertising and promotional spending.
- Administrative Expenses: Decreased by approximately $0.4 million, or 6.4%, from $6.0 million in FY2025 to $5.6 million in FY2026, mainly due to cost control measure.
- Finance Costs: Increased by approximately $0.1 million, or 19.4%, from $0.3 million in FY2025 to $0.4 million in FY2026, mainly due to new borrowings drawn down during the year.
- Other Losses: Increased by approximately $4,000, or 25.0% from $16,000 in FY2025 to $20,000 in FY2026. This increase was due to the increase in plant and equipment written off of approximately $9,000 and bad debts written off of approximately $1,000, partially offset by the absence of an allowance for impairment of trade receivables of approximately $6,000 recognised in FY2025.
Income Tax Expense:
Income tax expenses decreased by approximately $29,000, or 37.2%, from $78,000 in FY2025 to $49,000 in FY2026, mainly due to higher losses before income tax from subsidiaries in Singapore and Malaysia.
Loss for the year:
As a result of the above, the Group recorded a loss after tax of approximately $2.0 million in FY2026, compared to a loss after tax of $0.3 million in FY2025.
2H2026 vs 2H2025
Statement of Comprehensive Income
Revenue
Business Segments:
Revenue decreased by approximately $0.3 million, or 2.3%, from $12.9 million in 2H2025 to $12.6 million in 2H2026. The decrease was primarily attributable to lower sales across all the segments except for General Trade segment.
- Modern Trade Segment: Revenue fell by approximately $0.2 million, or 6.3%, from $3.2 million in 2H2025 to $3.0 million in 2H2026, largely due to subdued consumer demand and heightened competition from supermarket house brands.
- General Trade Segment: Revenue increased by approximately $0.4 million, or 8.5%, from $4.7 million in 2H2025 to $5.1 million in 2H2026, supported by higher demand in Malaysia.
- Food Services Segment: Revenue decreased by approximately $0.2 million, or 5.3%, from $3.8 million in 2H2025 to $3.6 million in 2H2026 mainly due to weaker sales amid increasing competition in the Food and Beverage industry.
- Others Segment: Revenue decreased by approximately $0.3 million, or 25.0%, from $1.2 million in 2H2025 to $0.9 million in 2H2026, due to weaker export demand.
Geographical Information:
- Singapore Market: Revenue decreased by approximately $1.1 million, or 10.9%, from $10.4 million in 2H2025 to $9.3 million in 2H2026, reflecting lower consumer demand across all segments.
- Malaysia Market: Revenue increased by approximately $0.9 million, or 47.2%, from $2.0 million in 2H2025 to $2.9 million in 1H2026, mainly attributable to higher demand from the customers, particularly customers from General Trade and Food Services segments.
- Other Markets: Revenue decreased by approximately $0.1 million, or 19.4%, from $0.5 million in 2H2025 to $0.4 million in 2H2026, due to weaker export sales.
Cost of Sales:
Cost of sales increased by approximately $0.2 million, or 1.3%, from $10.3 million in 2H2025 to $10.5 million in 2H2026 mainly due to higher energy costs, particularly diesel, amid the geopolitical tensions in the Middle East.
Gross Profit and Gross Profit Margin:
Gross profit declined by approximately $0.4 million, or 16.4%, from $2.6 million in 2H2025 to $2.2 million in 2H2026. Gross profit margin decreased from 20.2% in 2H2025 to 17.2% in 2H2026, mainly due to lower production efficiency arising from reduced production volume, which was attributable to lower sales and the Malaysia factory not yet operating at full capacity pending approval of the export permit from relevant authorities.
Other Income and Gains:
Other income and gains decreased by approximately $0.4 million, or 61.0%, from $0.7 million in 2H2025 to $0.3 million in 2H2026. The decrease was mainly attributable to the absence of gain on disposal of an investment in a joint venture of approximately $0.5 million recognised in 2H2025. This is partially offset by an increase in government grants and rebates of approximately $0.1 million in 2H2026.
Expenses
- Marketing and Distribution Costs: Decreased by approximately $0.1 million, or 10.5%, from $1.2 million in 2H2025 to $1.1 million in 2H2026, mainly due to lower advertising and promotional spending.
- Administrative Expenses: Decreased by approximately $0.1 million, or 3.1%, from $3.0 million in 2H2025 to $2.9 million in 2H2026, reflecting the Group’s cautious spending.
- Finance Costs: Increased by approximately $20,000, or 11.6%, from $172,000 in 2H2025 to $192,000 in 2H2026, mainly due to higher interest expenses arising from the new borrowings.
- Other Losses: Decreased by approximately $2,000, or 40.0% from $5,000 in 2H2025 to $3,000 in 2H2026, mainly due to lower write-offs of plant and equipment.
Income Tax Income:
Income tax income decreased by approximately $49,000 from tax credit of approximately $128,000 in 2H2025 to tax credit of approximately $79,000 in 2H2026, mainly due to a lower reversal of previously over-recognised income tax expense by the Group’s subsidiaries in Singapore and Malaysia. This is partially offset by the recognition of deferred tax expense during the period.
Loss for the Financial Period:
Income tax income decreased by approximately $49,000 from tax credit of approximately $128,000 in 2H2025 to tax credit of approximately $79,000 in 2H2026, mainly due to a lower reversal of previously over-recognised income tax expense by the Group’s subsidiaries in Singapore and Malaysia. This is partially offset by the recognition of deferred tax expense during the period.
Statement of Financial Position
The comparative commentary for both the assets and liabilities are based on the Group’s financial statements as at 30 June 2026 and 30 June 2025.
Non-current Assets
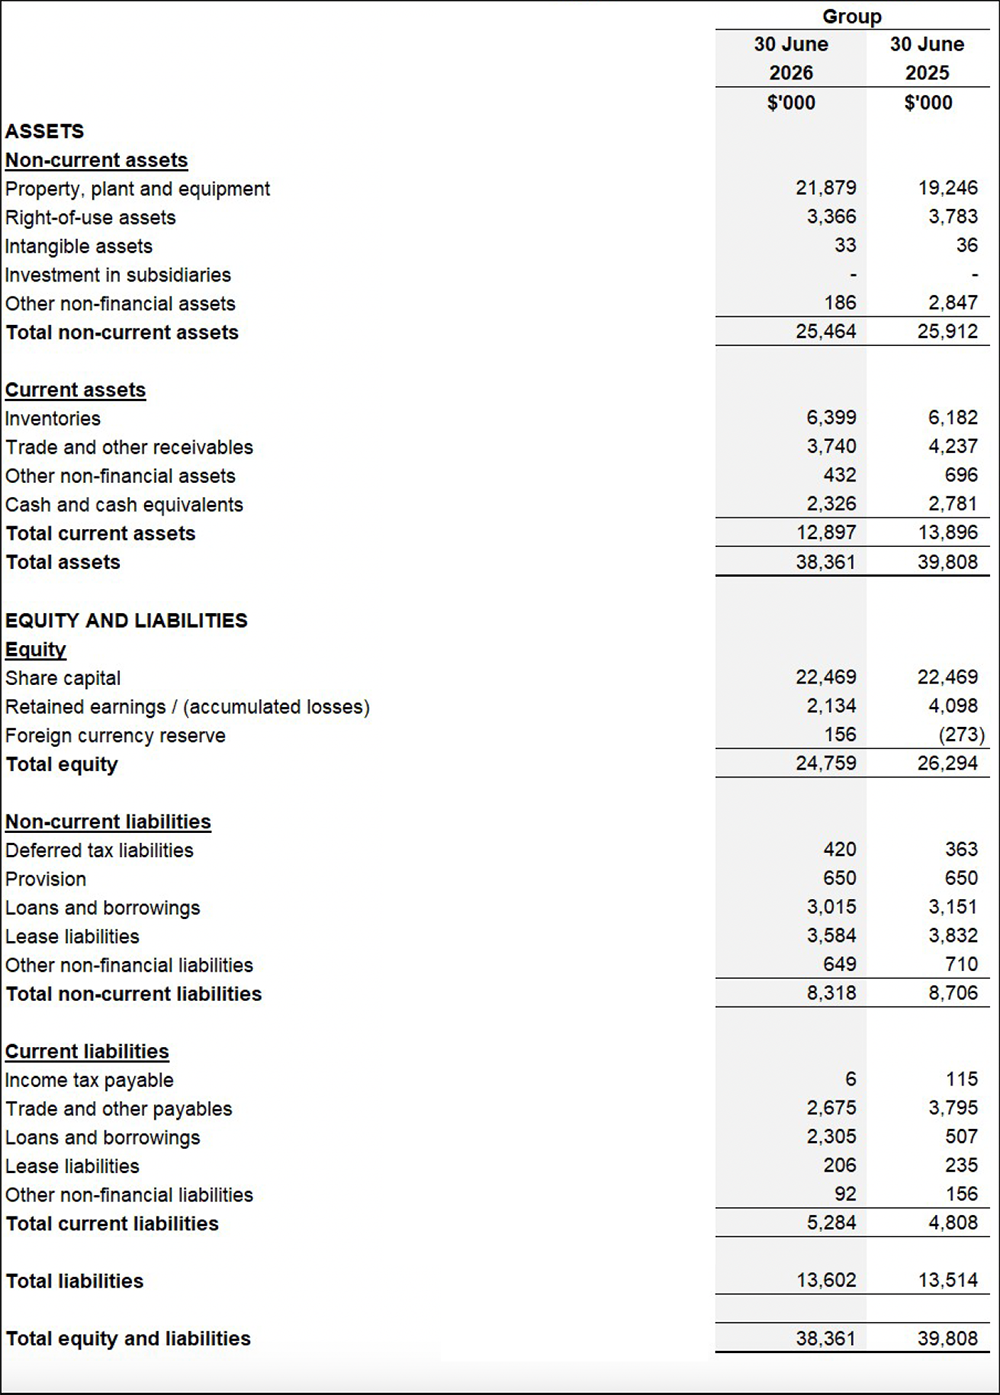
Non-current assets decreased by approximately $0.4 million, from $25.9 million as of 30 June 2025 to $25.5 million as of 30 June 2026.
Property, plant and equipment (“PPE”) increased by approximately $2.7 million, from $19.2 million as of 30 June 2025 to $21.9 million as at 30 June 2026. This was primarily due to additions of PPE amounting to approximately $4.0 million, including renovation works reclassified from other nonfinancial assets upon completion of the renovation works as at 30 June 2026, as well as machinery and equipment acquired amounting to $1.3 million during the year for the newly set-up factory in Malaysia. and an exchange translation gain of approximately $0.5 million arising from the translation of SGD-denominated acquisition costs, partially offset by depreciation charges of approximately $1.9 million and plant and equipment written off of $19,000.
Right-of-use assets decreased by approximately $0.4 million, from $3.8 million as of 30 June 2025 to $3.4 million as of 30 June 2026, mainly due to depreciation charges.
Intangible assets decreased by approximately $3,000 mainly due to depreciation charges.
Other non-financial assets decreased by $2.6 million from $2.8 million as at 30 June 2025 to $0.2 million as at 30 June 2026. The reduction was mainly due to the reclassification of renovation works from other non-financial assets to PPE upon the completion of renovation works as at 30 June 2026.
Current Assets
Current assets decreased by approximately $1.0 million, from $13.9 million as at 30 June 2025 to $12.9 million as at 30 June 2026. This decrease was primarily due to decrease in cash and cash equivalents of approximately $0.5 million, a decrease in other non-financial assets of $0.2 million and a decrease in trade and other receivables of approximately $0.5 million in line with the decrease in sales. This is partially offset by an increase in inventory of approximately $0.2 million.
The decrease in cash and cash equivalents is further explained in the Cash Flows Statement section. The reduction in other non-financial assets was due to reduction in prepayments of approximately $0.2 million and reduction of deposit paid for trade purchases of approximately $0.1 million.
Non-current Liabilities
Non-current liabilities decreased by approximately $0.4 million, from $8.7 million as at 30 June 2025 to $8.3 million as at 30 June 2026. This was primarily due to a decrease in lease liabilities of approximately $0.2 million and a decrease in loans and borrowings of approximately $0.2 million.
Current Liabilities
Current liabilities increased by approximately $0.5 million, from $4.8 million as at 30 June 2025 to $5.3 million as at 30 June 2026. The increase was mainly attributable to an increase in loans and borrowings of approximately $1.7 million, primarily due to bank and director’s loan of approximately $3.5 million and foreign exchange translation of approximately $0.2 million in respect of Malaysia Ringgit denominated bank borrowing, offset by the repayment of bank borrowings of approximately $2.0 million. The overall increased in current liabilities is partially offset by the decrease in trade and other payables of approximately $1.1 million, due to lower purchases and payments to vendors, a decrease in other non-financial liabilities of approximately $0.1 million due to the amortisation of deferred capital grants and a reduction of income tax payable of approximately $0.1 million.
Statement of Cash Flows
The Group generated approximately $0.6 million in cash from operating activities before working capital changes. After taking into account net working capital outflows of approximately $0.6 million and tax payments of approximately $0.1 million, the Group used approximately $0.1 million in net cash from operating activities.
The net working capital outflows were primarily due to a decrease in trade and other receivables of approximately $0.5 million, other non- financial assets of approximately $0.3 million, trade and other payables of approximately $1.1 million and other non- financial liabilities of approximately $31,000. This is partially offset by the increase in inventories of approximately $0.2million.
Net cash used in investing activities amounted to approximately $1.3 million, mainly due to the purchase of property, plant and equipment.
Net cash from financing activities amounted to approximately $0.9 million, mainly due to the new bank borrowings of approximately $1.5 million and borrowing from directors of the Company of approximately $2.0 million, partially offset by the repayment of loans and borrowings of approximately $2.0 million, payment of lease liabilities of approximately $0.4 million and interest paid of approximately $0.2 million.
As a result of the above, the cash and cash equivalents decreased by approximately $0.5 million, from $2.6 million as at 30 June 2025 to $2.1 million as at 30 June 2026.
Commentary
The Group continues to operate in a challenging environment driven by multiple external pressures, and intense market competition. Prices of key raw materials, labour and other operating inputs remain elevated compared with historical levels, while the retail landscape continues to be highly competitive, particularly with the increasing presence of supermarkets' private-label products as described as house brands in this announcement.
In addition, the broader business environment remains uncertain. Ongoing geopolitical tensions, evolving international trade policies, fluctuations in global commodity prices, including meat products, and higher freight costs continue to contribute to supply chain volatility and cautious market sentiment.
Against this backdrop, the Group remains focused on prudent cost management and operational discipline. Efforts have continued to enhance production efficiency, optimise distribution processes and strengthen overall operational effectiveness, while maintaining measured investments in sales and marketing activities to support its established brands. Management will continue to closely monitor market developments and adapt its operating strategies as appropriate in response to changing business conditions.